All case studies
Case study · GrabFood · Bang Tao, Phuket, Thailand
Etna Phuket: Orders doubled — on falling traffic
May — July 2026 (2 months)
+87%
revenue
x2.2
orders
34.6x
ads ROAS
The situation before we started
A Bang Tao restaurant in decline: revenue −21.7%, orders −17.7% versus the previous period. 39,211 people saw the listing monthly but only 182 ordered — a 0.5% through-conversion versus our fleet average of 0.9%. The traffic was there; the money wasn't.
- Downward trend: revenue −21.7%, orders −17.7% versus the previous period
- Through-conversion of 0.5% — half our fleet average (0.9%)
- Only 5.2% of viewers opened the menu — the listing didn't hook
- Ads CTR of 2.8% — paying for impressions nobody clicked
- ROAS 14.75x — ads profitable but underperforming after the impression
What we did — a 4-track strategy
1
Ads optimization
- Manual CPO instead of auto-bidding — the algorithm was buying cheap irrelevant impressions
- Daily management with adjustments to actual results
- Budget raised only 50% — ads revenue grew 3.4x
- Result: ROAS 14.75x → 34.57x
2
SEO & keywords
- Phuket + Bang Tao keyword map
- Keywords in dish names and descriptions
- Category structure rebuild
- The listing became clickable: CTR 2.8% → 5.59%
3
Funnel conversion
- Rebuilt what the customer sees: cover, first screen, menu presentation
- Reach → menu: 5.2% → 8.6%
- Menu → order: 9.0% → 19.7%
- Through-conversion x3.8: from 0.5% to 1.9% — double the fleet average
4
Rating & operations
- Daily rating and review monitoring
- Team training on operational metrics
- Offline-rate and stock-out control
- Rating 4.6 → 4.8
Key results
+87%
revenue growth
236,975 → 443,861 THB/mo
x2.2
order volume
190 → 411 a month
34.6x
ads ROAS
was 14.75x
x3.8
through-conversion
0.5% → 1.9%
x2.0
ads CTR
2.8% → 5.59%
−31%
cost per order
42 → 29 THB
| Metric | Before | After |
|---|---|---|
| Monthly revenue | 236 975 THB | 443 861 THB |
| Monthly orders | 190 | 411 |
| Through-conversion (reach → order) | 0.5% | 1.9% |
| Menu → order conversion | 9.0% | 19.7% |
| Ads ROAS | 14.75x | 34.57x |
| Ads-attributed revenue | 124 000 THB | 421 000 THB |
| Rating | 4.6 | 4.8 |
| Reach (seasonal decline) | 39 211 | 21 330 (−46%) |
The GrabFood data
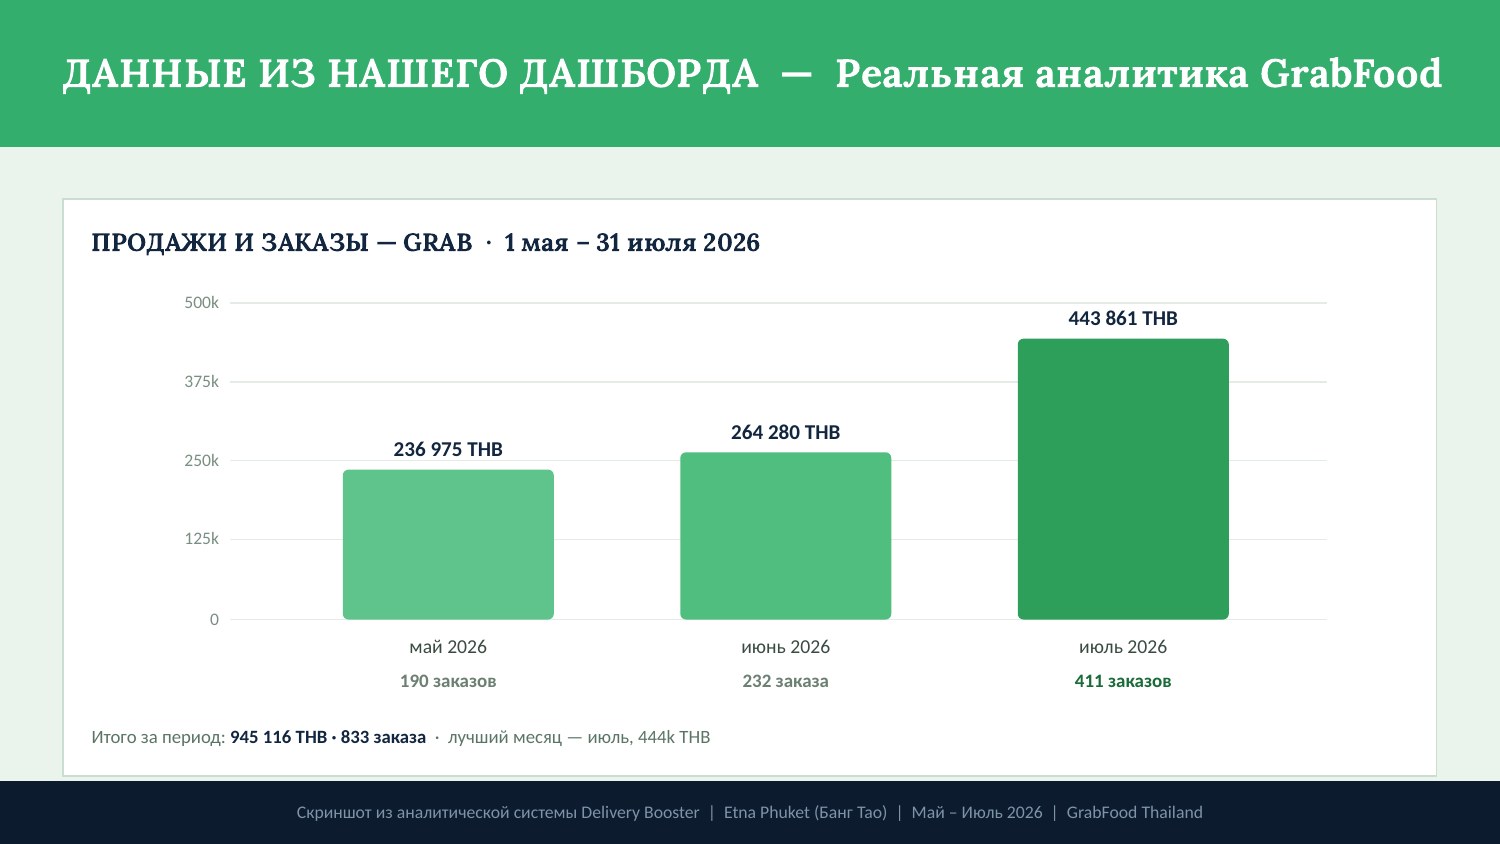
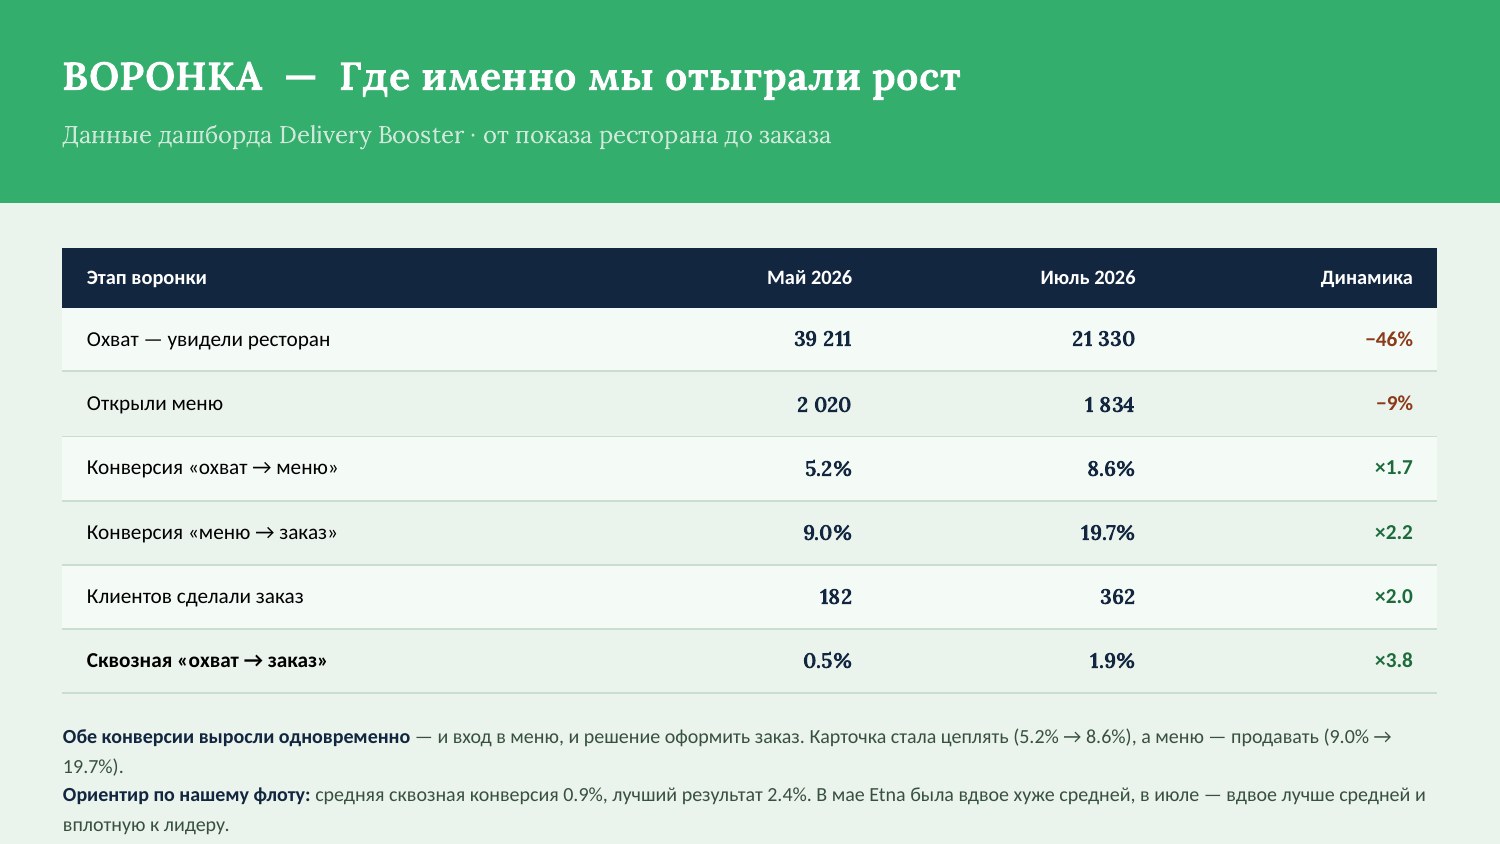
Real client data from GrabMerchant.
Want the same growth for your restaurant?
We did it for Etna Phuket. We'll do it for you — free profile audit within 24 hours.
Check my listing free